Bulls may continue pushing up the price
FLOWUSD Price Analysis – August 11
When the bulls increase their momentum, the price will penetrate the resistance level at $3.1, the resistance levels of $3.4 and $3.6 may be reached. Should the bears push down the price, it will be declined towards the support levels at $2.5, $1.8 and $1.2.
FLOW/USD Market
Key levels:
Resistance levels: $3.1, $3.4, $3.6
Support levels: $2.5, $1.8, $1.2
FLOWUSD Long-term trend: Bullish
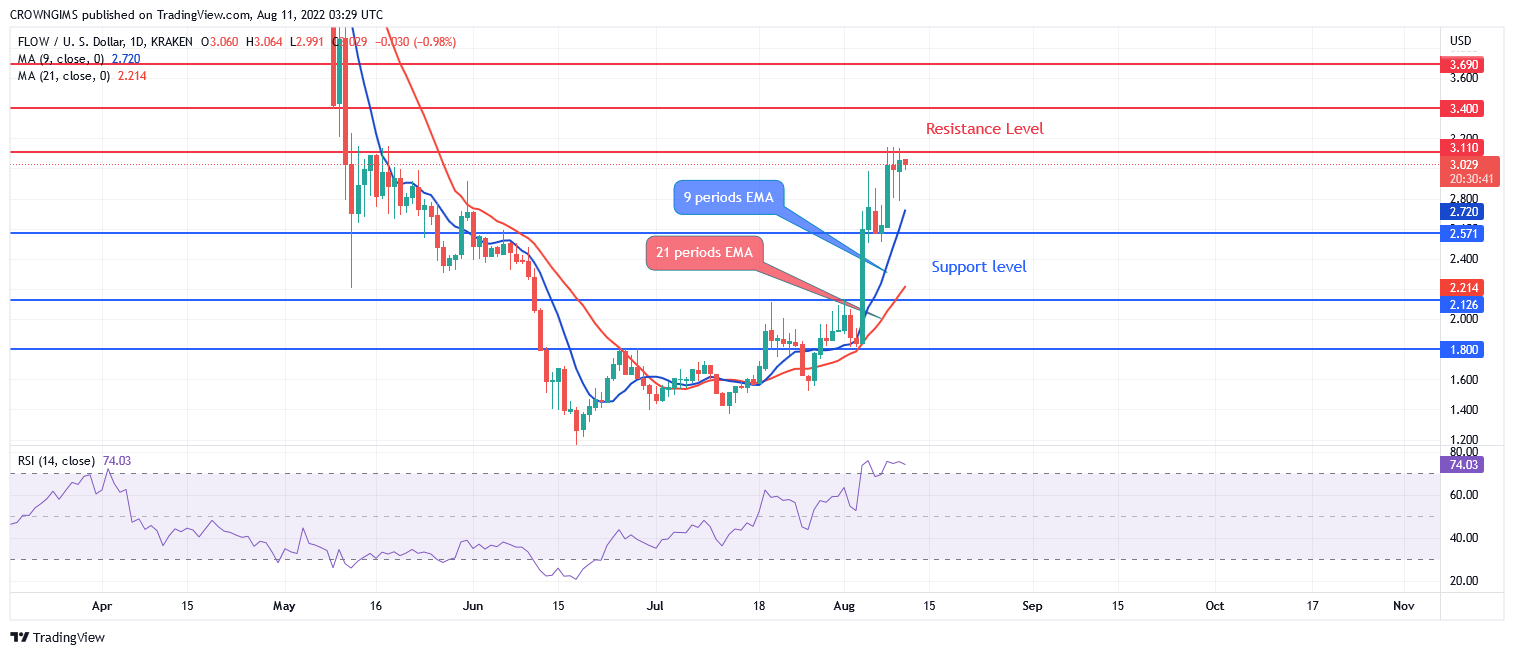
Flow is bullish in the daily chart. The sellers dominated the market till the price found support at the $1.25 level. The sellers’ momentum failed as the buyers opposed the bearish momentum with the formation of an inside bar candle. The coin bounces up and penetrate the former resistance levels of $1.8, and $2.5. At the moment, the price is testing the resistance level of $3.1.

There is an increase in the bulls’ momentum as the FLOW is trading above the 9 periods EMA and 21 periods EMA. When the bulls increase their momentum, the price will penetrate the resistance level at $3.1, the resistance levels of $3.4 and $3.6 may be reached. Should the bears push down the price, it will be declined towards the support levels at $2.5, $1.8 and $1.2. The relative strength index period 14 is at 73 levels with the signal line pointing up to indicate buy signal.
Your capital is at risk.
FLOWUSD medium-term Trend: Bullish
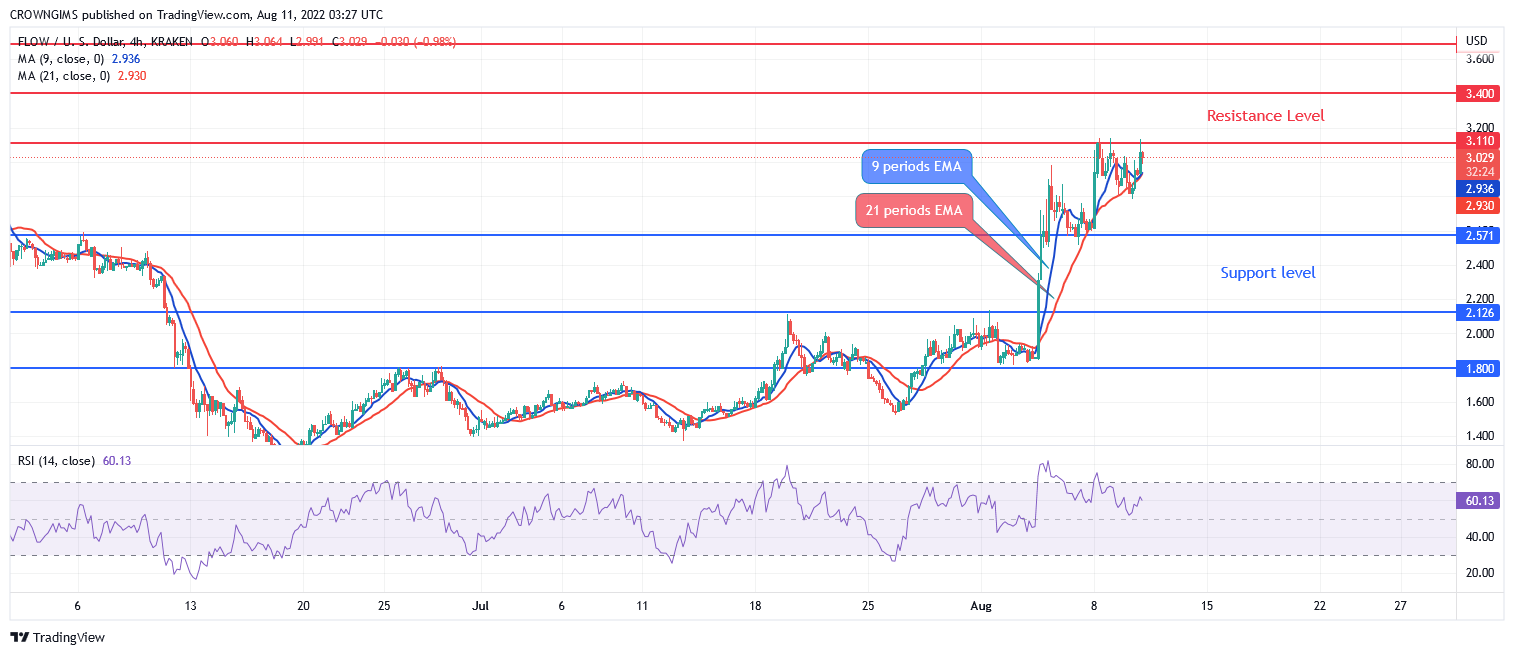
Flow is bullish in the 4-hour time frame. The coin technically changed to bullish direction when the price reached the low of $1.2 on June 19. Price steadily increases as more bullish candles are producing which indicate an increase in the buyers’ pressure. The price is currently consolidating around the resistance level of $3.1.

Flow is trading above the 9 periods EMA and 21 periods EMA. The Relative Strength Indicator period 14 is above 59 levels exhibiting a buy signal.
Related
Tamadoge – Play to Earn Meme Coin
- Earn TAMA in Battles With Doge Pets
- Capped Supply of 2 Bn, Token Burn
- NFT-Based Metaverse Game
- Presale Live Now – tamadoge.io


